
Compare This Month Against Last Year Without Doing the Math
Reading Time: 4 minutes
Capitan’s September 14, 2026 release makes gym revenue comparison something you read rather than something you calculate. The Chart Builder now shows its numbers in a table under the chart, dashboards can carry those tables as tiles, a new metric type charts membership status changes like freezes and cancellations, and guest passes gain a third mode aimed at customers who have not visited in a while. Also in the release: a new Awaiting Payment Method membership status, check-in alerts when a climber lacks a proficiency their location requires, and smaller reporting and booking changes.
It is the 18th of the month, and someone on your team wants to know whether you are tracking ahead of last year.
The chart says you are up eleven percent. That is a direction, not an answer. The figure you want to repeat in a meeting is a dollar amount, and the chart is a set of plotted points.
So you download the export, open it, and look for the 14th. Staff asked our support team for this often enough that it became the obvious thing to build.
Why a month in progress is hard to judge
Comparing a finished month against a finished month is arithmetic. Comparing eighteen days against a full month is a category error, and most operators have made it at least once, usually in the first week of January.
Honest month over month gym revenue means eighteen days against the same eighteen days. That is standard practice outside gym software too: Google Analytics compares a range against the same range last year to date rather than against the full prior year, for exactly this reason.
Gym revenue comparison you can read off the chart
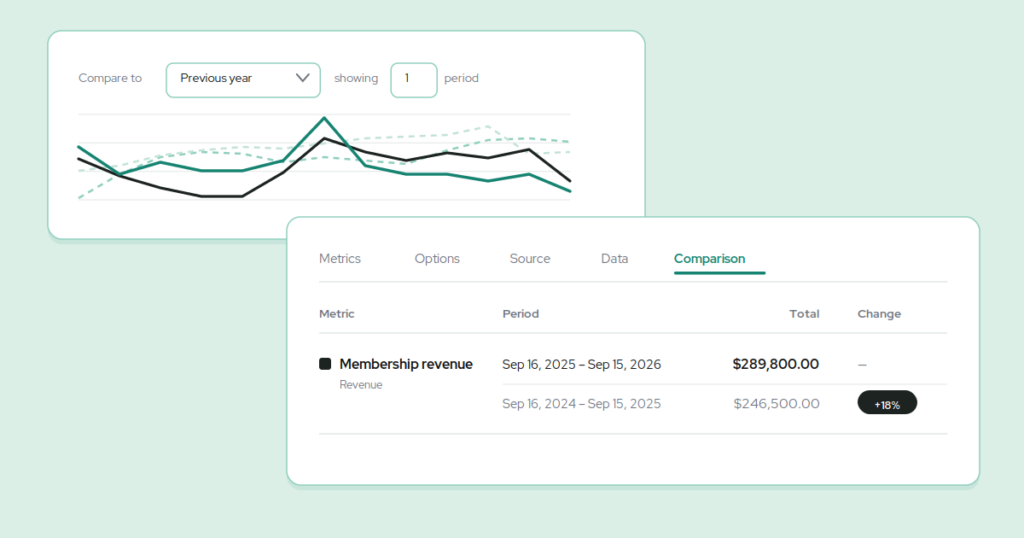
A chart in the Chart Builder, Capitan’s custom reporting tool, now carries two tabs beneath it. Data lists the chart’s numbers as a table with a total row, so the figure for any single day sits on the same screen as the chart it came from.
Comparison appears on any chart with a Compare to period set, and shows two figures for each comparison period: the elapsed portion, and the full period. Both numbers, side by side, with no arithmetic in between.
What that looks like on the 18th
Set a revenue chart to this month and compare it to the same month last year. The Comparison tab gives you last year’s first eighteen days and last year’s full month as separate figures. At $42,000 against $38,000 for the same eighteen days you are ahead, and the $71,000 last year finished at is context, not a verdict.
The same numbers on a dashboard
A dashboard is the page staff leave open, so the numbers belong there too. Alongside the existing chart tile, a custom gym reporting dashboard can now carry a Data Table tile and a Comparison Table tile, each built from a chart exactly as a chart tile is.
Data Table tiles offer Rows per Page, so a long daily series does not swallow the page. Comparison Table tiles group by metric and need no paging. A Comparison Table needs a chart with a Compare to period behind it, and the tile setup says so while you are choosing.
Saving a dashboard offers one more option: start the Locations filter on each viewer’s own location, so one manager dashboard shows every manager their own site first. It complements the ability to filter reports by location rather than replacing it.
A membership freeze report, and the rest of the status changes
The second half of a good comparison is knowing what moved. A new Membership Status Changes metric type counts membership events over time and charts them like any other metric. You pick the event each metric counts, from Frozen, Unfrozen, Ended, Payment Failed, Payment Recovered and Ended after Payment Failure, and you can filter by billing location and by membership. Historical counts are included, so the chart looks backward from day one instead of starting from today.
Charting freezes against unfreezes across a summer tells you whether your freeze policy is a retention tool or a slow exit, and Payment Failed against Payment Recovered tells you how much involuntary churn your dunning is catching. Both are period-over-period questions, so the Comparison tab applies to them too. Any metric type can also be asked for in plain English through Chart Assistant.
Lapsed customer guest passes, for acting on what you see
A chart of Ended memberships earns its place through what you do next. Guest passes now have a third mode, Lapsed Customers Only, for customers whose last check-in at any of your locations was more than a set number of months ago, along with customers who have never checked in at all.
The number of months is one organization-wide setting, defaulting to 12, and changing it applies immediately to every outstanding pass. The new mode appears wherever the other two already do: membership types gain a third guest pass benefit with its own count and frequency, and manual pass creation offers all three modes in one dropdown.
The Use Guest Pass picker also explains itself. Passes a customer is not eligible for are listed but disabled with the reason attached, such as “Not eligible: customer last checked in on 3 Mar 2026”. Eligible passes sort to the top. If the strategy behind this is the part you want, we wrote about how to win back lapsed members without discounting the ones you already have.
Also worth knowing
The Payments report gains a Time column on screen and a raw Timestamp column in the export, which makes reconciling a processor payout considerably faster. Event attendee exports gain invoiced, paid and refunded amounts per attendee.
Common questions
How do I compare this month against last year when the month is not over?
Set a Compare to period on the chart and open the Comparison tab. It shows the elapsed figure and the full-period figure for each comparison period, so you can judge a partial month against the matching part of last year.
Can I put a gym revenue comparison on a dashboard?
Yes. Add a Comparison Table tile built from a chart that has a Compare to period set. For a plain list of figures with a total row, use a Data Table tile instead.
Who is eligible for a lapsed customer guest pass?
Customers whose last check-in at any of your locations is older than your organization’s threshold, which defaults to 12 months, plus customers who have never checked in. The
Published on 14 September 2026
Last updated on 15 September 2026
New gym in its first year? Let us help you

Continue reading
Join our community of growth-focused climbing gyms
Access roundtables with industry leaders. Share challenges. Exchange strategies. Our platform handles the heavy lifting while you leverage collective insights. Discover why leading climbing facilities choose Capitan.